Paper Graphs
16 Jan 2009With PaperCamp happening tomorrow, alongside BookCamp, I have spent some time this week thinking about paper.
The thought that caught my interest was how graphs can be represented with paper - not on paper, but with paper.
To cut a rambling story short, I’ve written a tool that takes a set of pie-chart data and produces a series of outlines that can be cut out and assembled to create a 3D model of the chart.


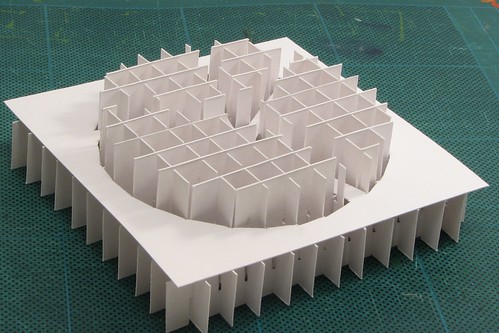
Having a physical embodiment of the raw data means you can touch it, feel it, grope it; whatever helps you understand it.
I think I’ll leave it there for now; it’s late, I have an early train to catch and I’ve used the word grope.
Update: as I mention in the comments, you can get your own custom paper pie chart from here.