More Paper Graphs
22 Oct 2010I had to go through old posts here to remind myself when I last did anything on my Paper Graphs project. I was surprised to find it was as long ago as January last year that I wrote about the paper pie charts after the first PaperCamp.
A couple weeks ago, we reconvened at the Mecca for all good conferences, Conway Hall, for PaperCamp2: Fold Harder. Roo’s done a nice write-up over here if you want to read more about the event itself.
Of the small number of talks during the day, it was the opening one from Matt Brown that chimed the most with me. His write-up is worth a read. The Origamic Architecture by Gerry Stormer reminded me of the books my parents had by Masahiro Chatani from which I learnt a lot of the principles used in the paper pie charts.
At the first PaperCamp, I said I wanted to produce a pop-up book of statistics. This was mostly an attempt to put the hastily crafted pie chart into some sort of context and I didn’t put much more thought into it. It’s still something I think would be fun to do - if I can find the right angle to approach it with. In the meantime, I felt inspired to start playing with other paper graph styles. Specifically, the humble bar chart.
Having sketched a few ideas along the lines of Stormer’s work, I went back to the style of the pie graph. A bit more prototyping later and here’s where I got to.

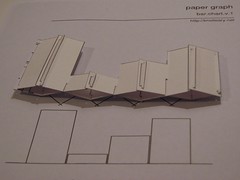
As with the pie charts, the pieces for the model are automatically generated and spat out as a pdf. I’ve updated the project page so you can generate your own here. It isn’t perfect - particularly if the values have a large range - but I think it works well enough as-is.