TensorFlow in Node-RED
Installing TensorFlow nodes
For this workshop, we're going to use the node-red-contrib-tfjs-coco-ssd
module that provides the tf coco ssd node.
This module can be installed from the Manage Palette option in the editor, or by
running the following command in ~/.node-red:
npm install node-red-contrib-tfjs-coco-ssd
This will install the module and the TensorFlow library it depends on.
Connecting TensorFlow to the WebCam
In this part, we'll setup the TensorFlow node to receive images from the WebCam.
- Add an instance of the
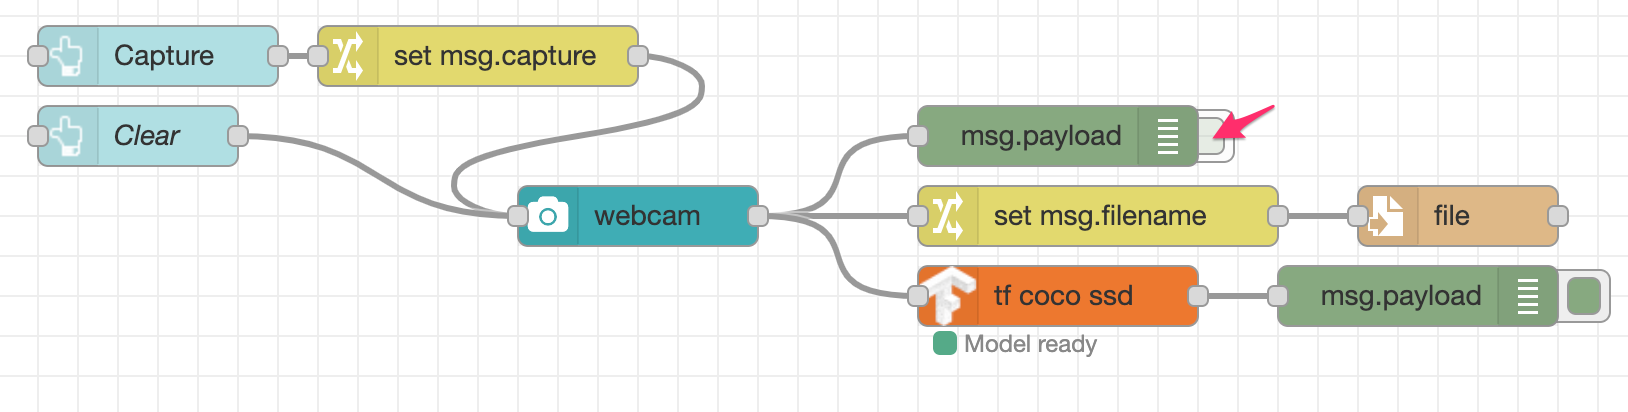
tf coco ssdnode from the "analysis" category of the palette into your workspace. - Wire the output of WebCam node to the input of the tf node.
- Make sure the WebCam node is configured to capture
jpegimages - we said we'd remind you about this. - Add a Debug node and connect it to the output of the tf node.
- Click the Deploy button to save your changes.
Muting Debug nodes
In this screenshot you can see I have muted the Debug node attached to the webcam node by clicking its button in the workspace. This can be useful to turn off different bits of Debug without unwiring or removing the nodes entirely.
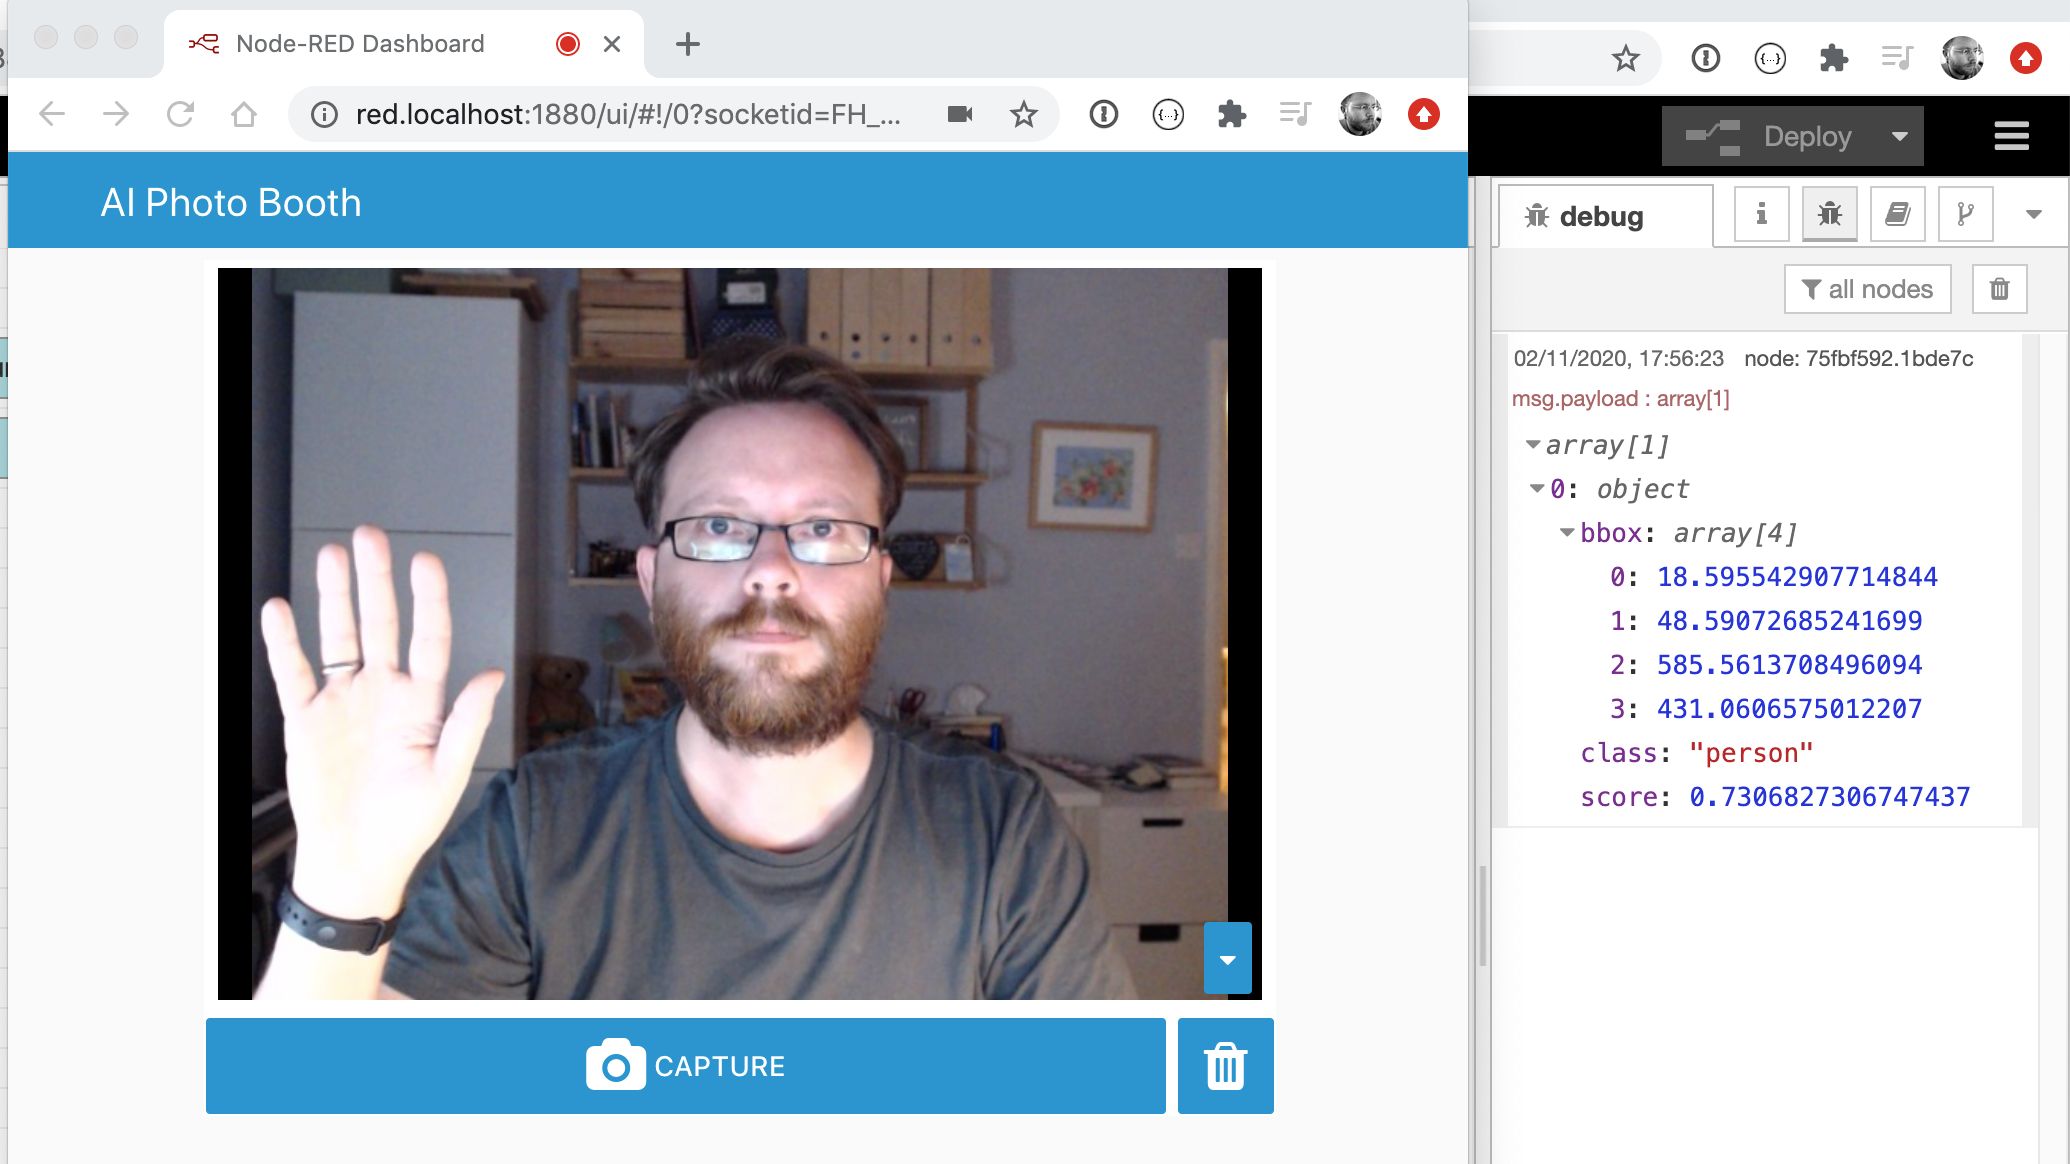
On the dashboard, make sure your webcam can see you and click the capture button. Switch back to the Node-RED editor and open the Debug sidebar panel. You should see the message sent by the tf node. Its payload consists of a list of the objects it has detected.
Each entry in the list has:
class- the type of objectscore- the confidence level of the detection, from0to1.bbox- an array giving the corners of the bounding box surrounding the detected object
msg.payload format
Each of the TensorFlow nodes uses a slightly different object format. For
example, the node-red-contrib-tf-* nodes set the className property
rather than class as we have here. If you experiement with the other nodes
make sure you read their documentation and use the Debug node to understand
their message format.
Next Steps
With TensorFlow integrated into the dashboard, the next task is to display the detected objects on the dashboard.