Displaying the detected objects
In this part we're going to display the detected objects on the dashboard in two different ways.
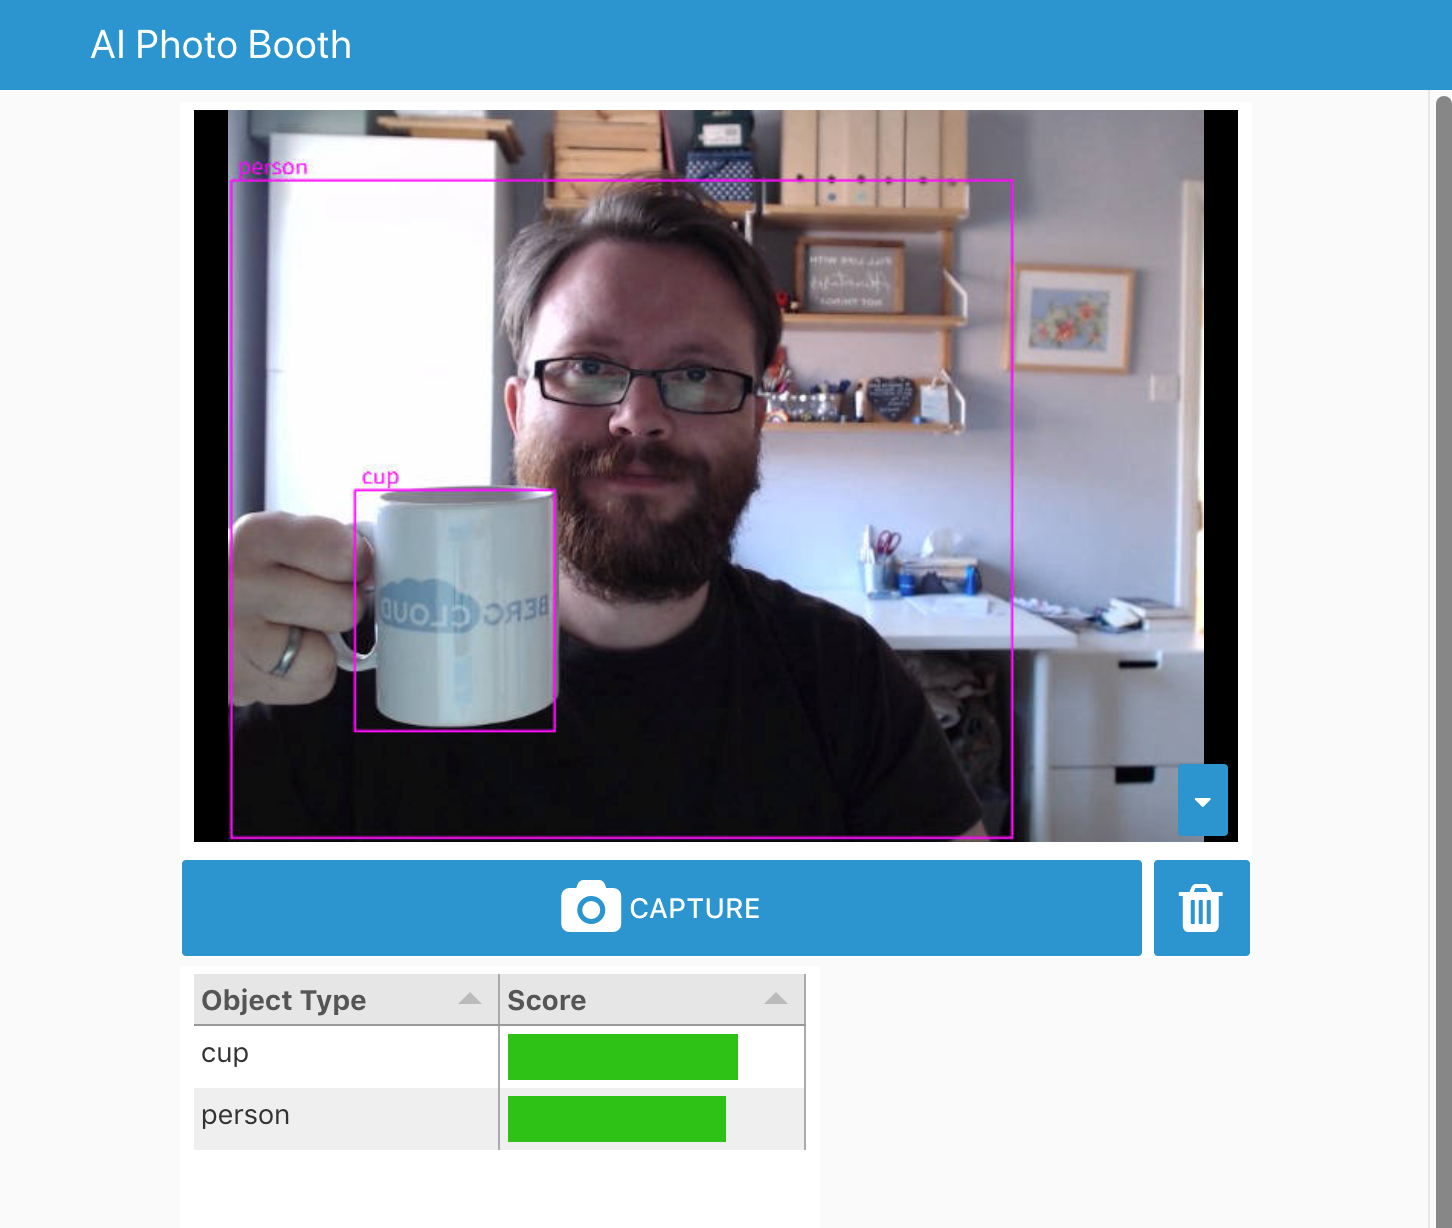
First we will display an annotated version of the captured image with all of the objects highlighted. We will then add a table to the dashboard that lists them out.
Displaying an annotated image
The tf coco ssd node has an option to output an annotated version of the image
with all of the detected objects highlighted. The image is set on the msg.image
message property.
-
Edit the
tfnode and configure the "Passthru" field toAnnotated Image
-
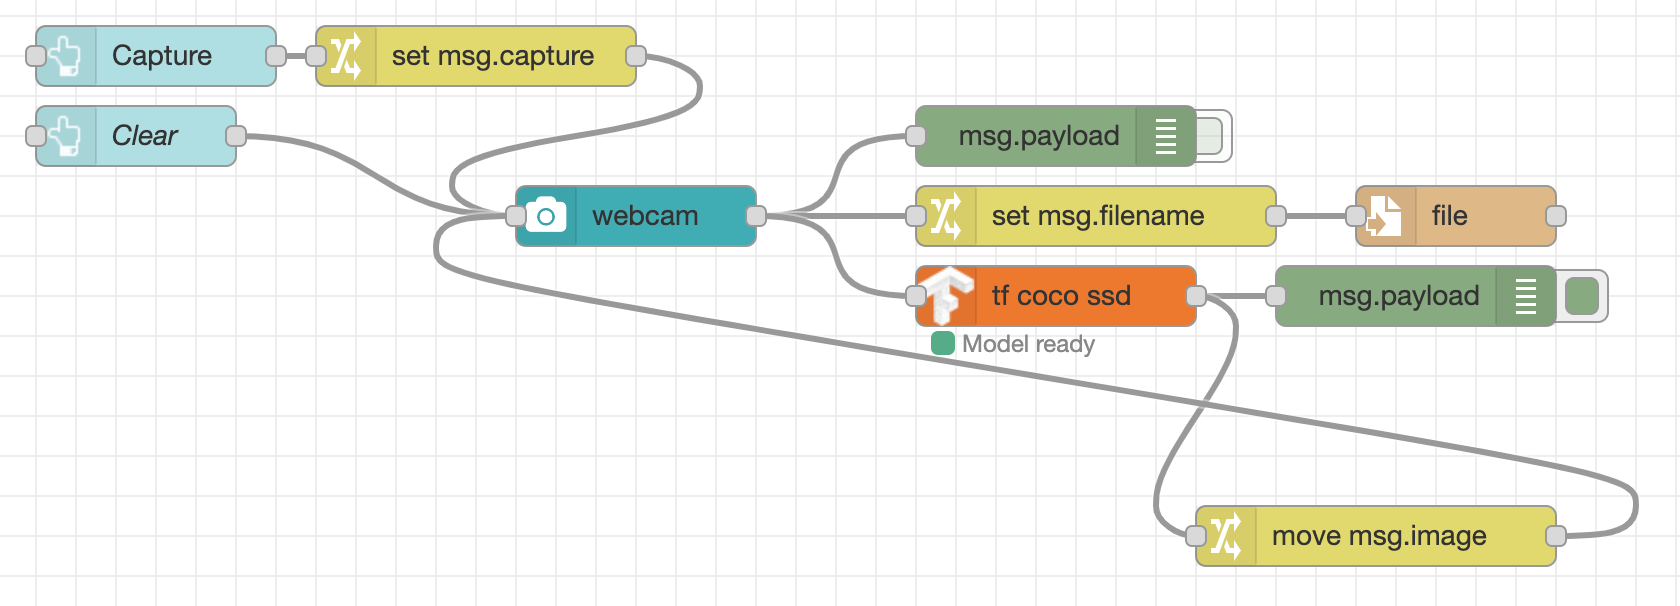
Add a Change node, wired to the output of the
tfnode and configure it to movemsg.imagetomsg.payload.
-
Wire the Change node to the input of the WebCam node.
- Click the Deploy button to save your changes.
Laying out flows
With this latest addition, you can see we now have wires crossing each other and looping back on themselves. As flows evolve, their wiring can become quite complex. It is always worth spending some time trying to find a layout that remains 'readable'.
There is a Flow Developer guide in the Node-RED documenation that provides a number of tips on how to layout flows.
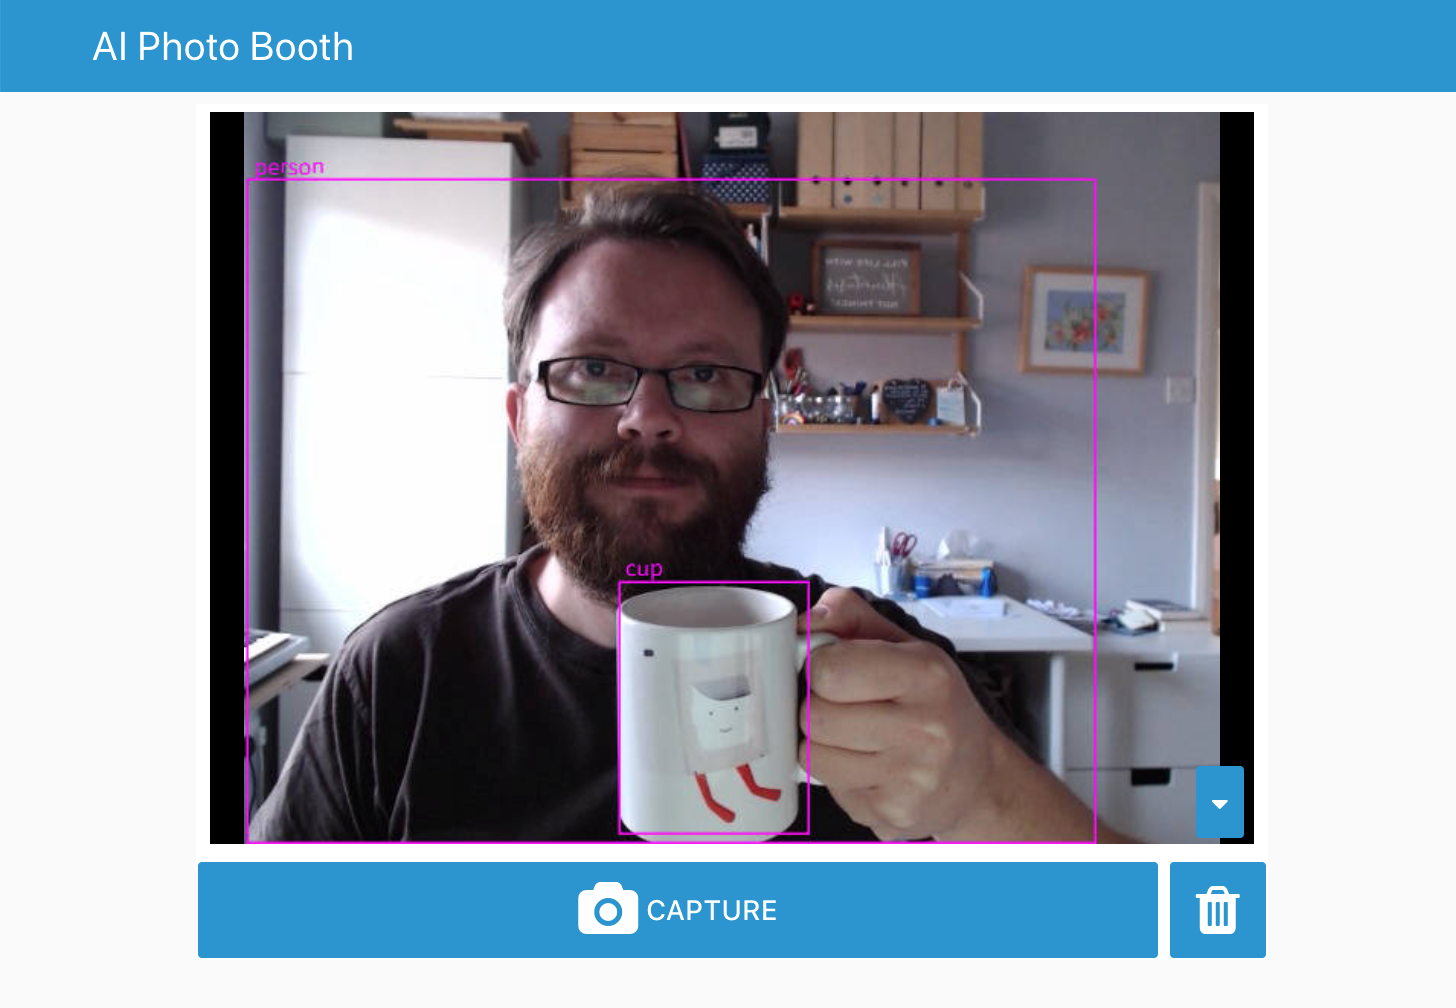
Now when you take an image on the dashboard, you should see the annotated version of the image.
Adding a table of objects
Install the module node-red-node-ui-table using the Manage Palette option in the
editor, or run the following command in ~/.node-red:
npm install node-red-node-ui-table
This adds the ui_table node to the palette which can be used to display tabular
data.
- In the Dashboard sidebar of the Node-RED editor, hover over the
AI Photo Boothtab and click the+ groupbutton. - Edit the new group and set its properties:
- Set the name to 'Objects'
- Set the width to
6by clicking the button and dragging the box out to 6 units wide. - Untick the 'Display group name' option.
-
Add a new
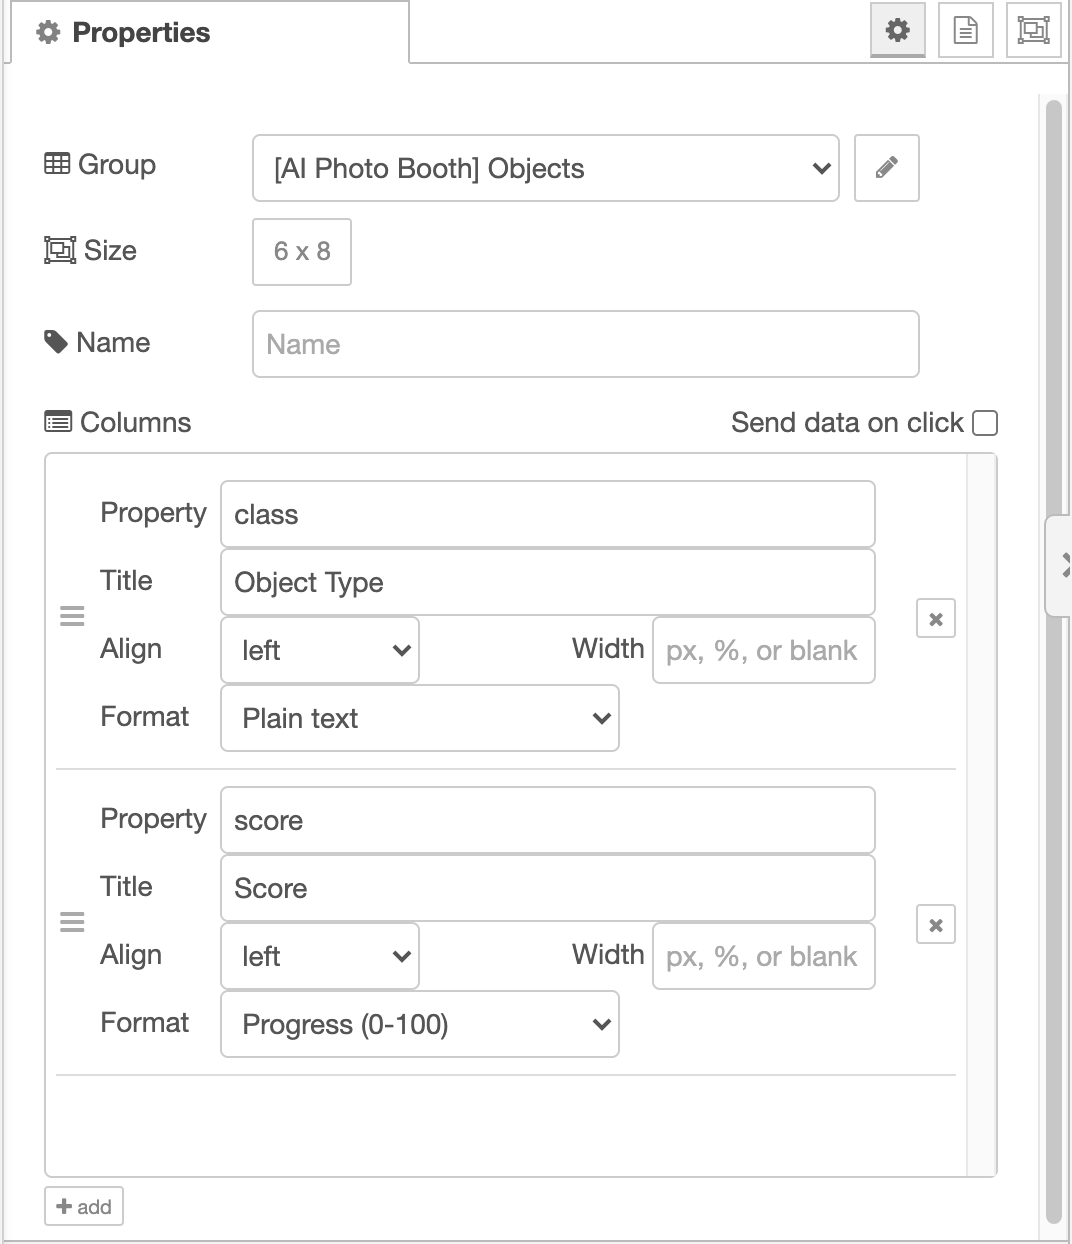
ui_tablenode from the "dashboard" section of the palette into your workspace. Edit its properties as follows:- Add it to the 'Objects' group
- Set its size to
6x8 - Add two columns by clicking the
+ addbutton at the bottom. Configure them as:- Property:
class, Title:Object Type - Property:
score, Title:Score, Format:Progress (0-100)
- Property:
-
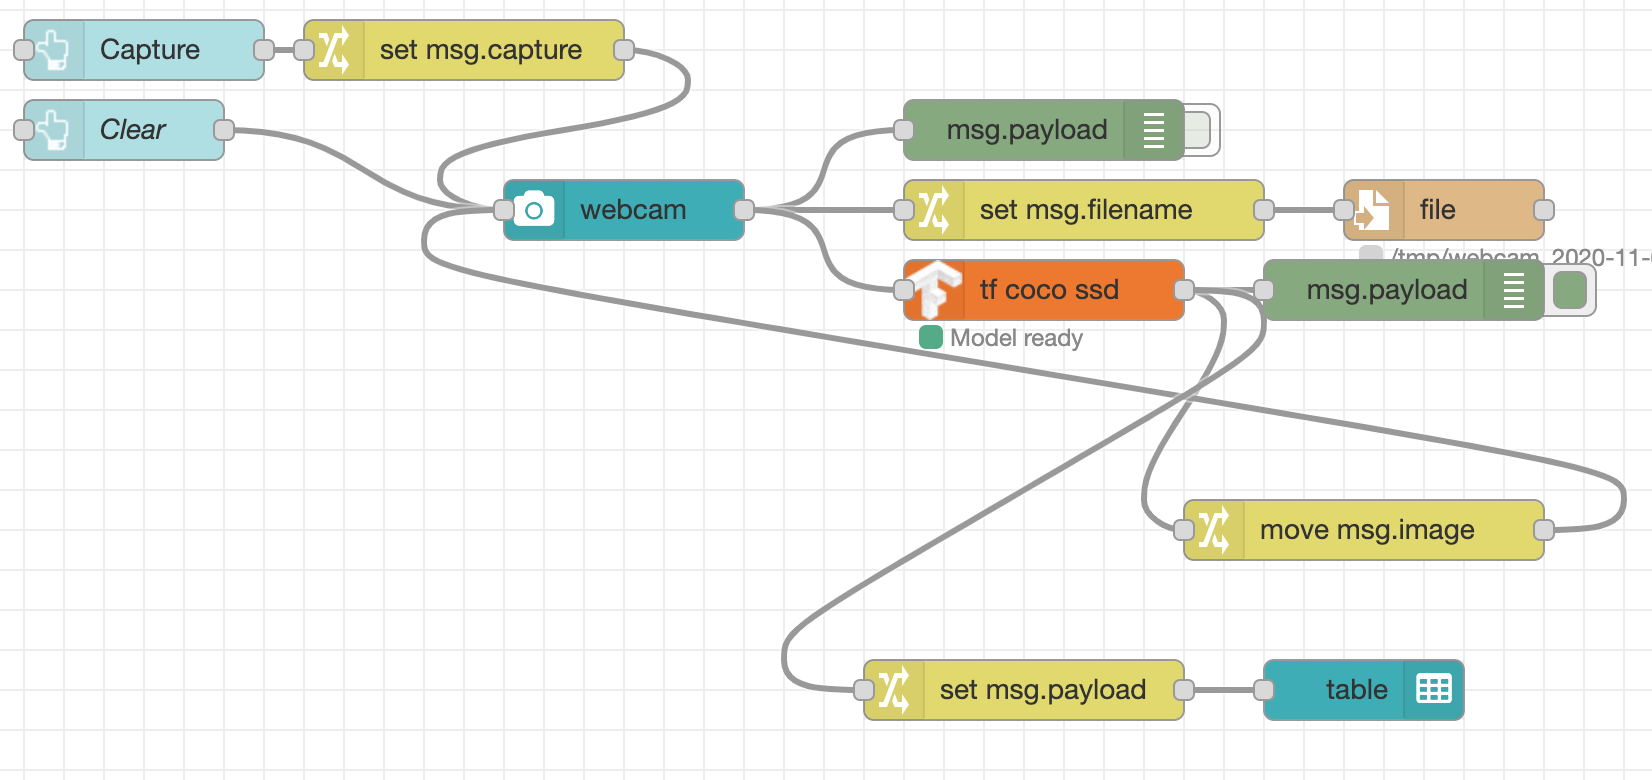
Add a Change node to the workspace. Configure it to set
msg.payloadto the expression$append([],payload.{"class":class,"score":score*100,"bbox":bbox})Note
Make sure you select the
expressiontype for thetofield of the Change node. This uses the JSONata expression language. -
Create the following wires between nodes:
- wire the output of the
tfnode to the Change node. - wire the output of the Change node to the Table node
- wire the output of the
- Click the Deploy button to save your changes.
Now when you capture an image on the dashboard, the table should list the detected objects.
Side Quest - Star Ratings
The JSONata expression used in the Change node mapped the score property
of each detected object from its original 0-1 range to the 0-100 range
expected by the ui_table node's "Progress" column type.
The table supports a number of other formats of displaying numeric values. For example, it can map a number in the 0-100 range to a traffic light colour. It can also display a value in the range 0-5 as a number of stars.
Edit the table node to display the score using the star format. See if you can
modify the expression in the Change node to map the original score to the required
0-5 range.
Side Quest - Clear the table
With the current dashboard, when an image is captured it gets displayed in place of the live web cam view until the clear button is clicked.
However clicking the button does not clear the table we've just added.
Using what you've learnt so far, build a flow between the Clear button and the table node that will clear the table when the button is clicked.
Hint: think about what payload must be passed to the table in order to clear it.
Next Steps
With the list of detected objects on the dashboard, the next task is to let the user select which object to display.